

MD&A · 2025
In this section4 topics
Overview of Operations
Overview of Operations
AAPICO Business in 2025
AAPICO Group (“The Company”) businesses are primarily engaged in the automotive industry. Its three core pillars of businesses are OEM Auto Parts Manufacturing business, Car Dealerships and Services Center business, and the IoT Connectivity and Mobility business. AAPICO’s main operations and facilities are located in four countries, namely Thailand, Malaysia, China, and Portugal.
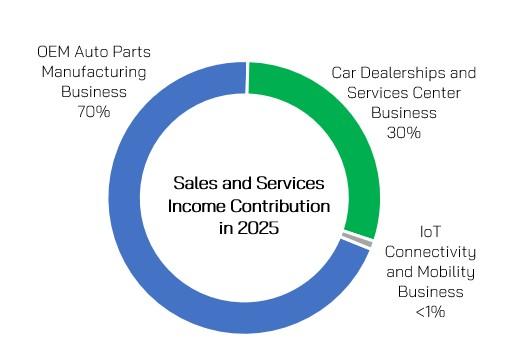
The Company’s sales and services income are mainly contributed from two core businesses, OEM Auto Parts Manufacturing business and Car Dealerships and Services Center business, with sale revenue contribution in 2025 of 70% and 30% respectively. Sales revenue contribution from technology sector in 2025 was still nominal at approximately less than 1% of total sales and services income.
OEM auto parts manufacturing business comprises metal forming parts, plastics parts, forging and machining parts, casting parts, and toolings (Assembly Jigs and Stamping Dies). Thailand operations are focused on most of automobile component except casting parts. China operation is manufacturing forging and machining parts. Portugal operation is producing casting and machining parts. Malaysia operation is producing hot press forming, assembly parts and tooling.
The Company operates car dealerships and service center for Mitsubishi and MG vehicles in Thailand and Honda and Proton vehicles in Malaysia.
Industry and Market in 2025
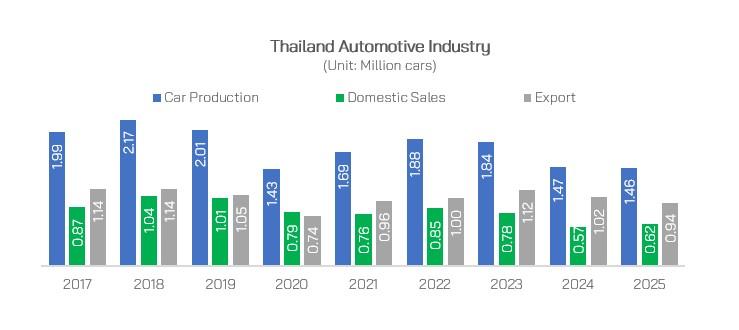
Thailand: The car production in Thailand reported a 0.9% decline to 1.46 million cars in 2025. Domestic volume increased by 8.5% to 0.62 million supported by promotional activities and the acceleration of EV deliveries toward the end of the EV 3.0 incentive program, particularly in the PHEV segment. Meanwhile, export decreased by 8.2% to 0.94 million cars, influenced by stricter safety and emission regulations in key markets, the discontinuation of certain vehicle models, softer demand in export markets, and heightened geopolitical uncertainties affecting global trade.
Malaysia: Total Industry Volume (TIV) of new vehicle sales in 2025 increased marginally by 0.5% year-on-year to a record 820,752 units, marking the second consecutive year above 800,000 units. Passenger vehicle sales rose to 759,098 units, supported by resilient consumer demand, new model launches, and aggressive sales promotions, while commercial vehicle sales declined to 61,654 units amid softer fleet demand. National carmakers continued to dominate the market, maintaining a market share of over 60%, supported by strong demand for compact and affordable models. Overall market performance was underpinned by a stable domestic economy, favorable financing conditions, and sustained consumer confidence.
Portugal: In 2025, Europe’s car production excluding Eastern Europe declined 3.6% YoY to 14.66 million units, reflecting ongoing economic uncertainty and residual supply chain constraints. Despite these challenges, battery electric vehicle (BEV) sales continued to grow year-on-year, supported by regulatory requirements, new model launches, and the expansion of charging infrastructure, underscoring the accelerating electrification trend across key European markets.
China: Total car production for 2025 rose 10.4% to 34.53 million units, surpassing 30 million units for the third time. Domestic sales grew 9.4% to 34.40 million units, while exports surged 21.1% to 7.10 million units, driven largely by strong demand for new energy vehicles (NEVs). NEV production and sales reached approximately 16.63 million and 16.49 million units, respectively, reflecting robust year-on-year growth and underscoring the increasingly important role of NEVs in driving the automotive industry’s expansion.
Operating Results & Financial Condition
Operating Results & Profitability
Profit and Loss Analysis
In 2025, Thailand’s automotive industry faced a challenging operating environment, with total vehicle production declining slightly year-on-year due to weaker export demand, while domestic sales showed gradual recovery. Our performance reflected these broader market conditions and industry trends.
Profit and Loss Statement | 2024 | 2025 | Change | % |
Sales and service income | 26,588 | 25,780 | (808) | (3.0%) |
Other income | 414 | 387 | (27) | (6.5%) |
Total Revenues | 27,002 | 26,167 | (835) | (3.1%) |
Less Cost of Sales and services | 24,277 | 23,589 | (688) | (2.8%) |
Gross Profit | 2,311 | 2,191 | (120) | (5.2%) |
Gross Profit Margin (%) | 8.7% | 8.5% | (0.2%) | |
Total expenses | 26,037 | 25,293 | (744) | (2.9%) |
Profit from operating activities | 966 | 874 | (92) | (9.4%) |
Share of profit from associates and JVs | 232 | 241 | 9 | 4.0% |
Finance income | 99 | 61 | (38) | (38.3%) |
Less Finance cost and Tax expenses | 548 | 431 | (117) | (21.3%) |
Less Non-controlling interests | 1 | 14 | 13 | 1,479.8% |
Net Profit attributable to equity holders | 747 | 731 | (16) | (2.1%) |
Net Profit Margin (%) | 2.8% | 2.8% | 0.0% | |
Earnings per shares | 2.15 | 2.18 | 0.03 | 1.2% |
Sales and services income
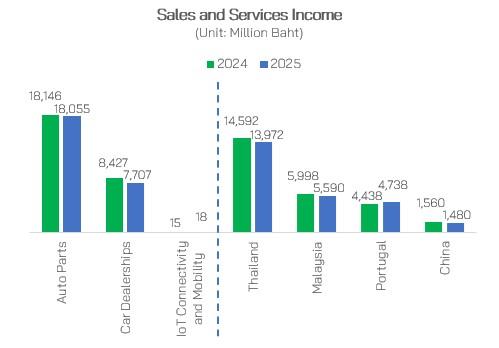
Sales and services income decreased by 3.0% YoY from Baht 26,588 million in 2024 to Baht 25,780 million in 2025, with a 0.5% decrease in automotive parts businesses and an 8.5% decrease in dealership businesses, respectively. The decline in sales and services income during 2025 was primarily attributable to lower revenue from the dealership businesses in both Thailand and Malaysia, which decreased by 7.0% and 9.4%, respectively. The reduction was significant during the first nine months of the year, before recovering in the final quarter, reflecting intensified competition in the automotive market, particularly from Chinese brands offering competitively priced models. Sales from the automotive parts business also recorded a slight decline. Sales from Thailand operations decreased by 3.6%, broadly in line with a slight contraction in Thailand’s automotive production, which declined by 0.9% year-on-year. Meanwhile, revenue from China operations declined by 5.1%, reflecting intense competitive pressures. Nevertheless, the overall impact was partially offset by revenue growth from operations in Portugal and Malaysia, which increase by 6.8% and 17.6% year-on-year respectively, demonstrating the Company’s ability to mitigate regional market volatility through its geographically diversified operating footprint.
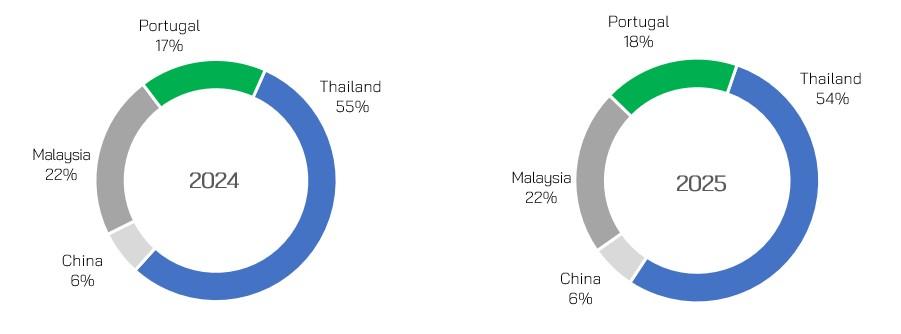
Sales contribution by country remained well diversified. In 2025, Thailand continued to contribute the highest sales at 54.2%, followed by Malaysia at 21.7%, Portugal at 18.4% and China at 5.7%.
Other income
Unit: Million Baht | 2024 | 2025 | Change | % |
Other income | 388 | 387 | (1) | (0.2%) |
Gain on exchange rate | 26 | - | (26) | (100.0%) |
Other income – Total | 414 | 387 | (27) | (6.5%) |
Other income primarily consists of technical fees, sales incentives from car sales, and commissions from financial institutions and insurance companies related to the car dealership businesses. In 2024, there was gain on exchange rate of Baht 26 million, compared to no gain on exchange rate in 2025.
Total Revenues
Total consolidated revenues decreased by 3.1% YoY from Baht 27,002 million in 2024 to Baht 26,167 million in 2025.
Gross Profit
Unit: Million Baht | 2024 | 2025 | Change | % |
Sales and service income | 26,588 | 25,780 | (808) | (3.0%) |
Cost of sales and services | 24,277 | 23,589 | (688) | (2.8%) |
Gross Profit | 2,311 | 2,191 | (120) | (5.2%) |
Gross Profit Margin (%) | 8.7% | 8.5% | (0.2%) |
Gross profit decreased from Baht 2,311 million in 2024 to Baht 2,191 million in 2025. Gross profit margin slightly declines from 8.7% in 2024 to 8.5% in 2025 mainly due to the impact of electricity blackout in Portugal during Q2 2025 which caused one of our plants to run at about 50% capacity for three weeks. The disruption occurred during a period of peak customer demand, resulting in higher fixed cost and increased reliance on inventory to fulfill orders.
Selling and Administrative Expenses
Unit: Million Baht | 2024 | 2025 | Change | % |
Selling and distribution expenses | 441 | 424 | (17) | (3.9%) |
Administrative expenses | 1,328 | 1,243 | (85) | (6.4%) |
Total SG&A expenses | 1,769 | 1,667 | (102) | (5.8%) |
Selling and administrative expenses decreased by 5.8% from Baht 1,769 million in 2024 to Baht 1,667 million in 2025.
Other Expenses
Unit: Million Baht | 2024 | 2025 | Change | % |
Loss on exchange rate | - | 2 | 2 | |
Other expenses (Reversal) | (10) | 35 | 45 | 443.4% |
Total Other Expenses | (10) | 37 | 47 | 466.0% |
Other expenses increased from an expected credit reversal of Baht 10 million in 2024 to expenses of Baht 37 million in 2025. This increase was primarily attributable to the recognition of expected credit losses on long-term loans to related parties, as well as impairment losses on investments.
Finance cost and Tax Expenses
Unit: Million Baht | 2024 | 2025 | Change | % |
Finance cost | 411 | 315 | (96) | (23.2%) |
Corporate tax expense (income) | 137 | 116 | (21) | (15.3%) |
Finance cost and Corporate Tax expense | 548 | 431 | (117) | (21.2%) |
Finance cost decreased by Baht 96 million from Baht 411 million in 2024 to Baht 315 million in 2025. Tax expenses decreased from Baht 137 million in 2024 to Baht 116 million in 2025 primarily due to lower taxable profit and deferred tax adjustments.
Share of profit (loss) from Equity Investments
In 2025, the Company’s share of profit from associates and joint ventures increased from Baht 232 million in 2024 to Baht 241 million. The increase was primarily attributable to a higher share of profit from PUREM AAPICO, which increased by approximately Baht 21 million. Sanoh Industries and Able Sanoh Industries also delivered solid performance, with profit contributions increasing from Baht 10 million and Baht 135 million in 2024 to Baht 12 million and Baht 136 million in 2025, respectively. However, Nuro Technology reported a shift from a profit of Baht 7 million in 2024 to a loss of Baht 5 million in 2025, primarily due to business cessation during the year. Meanwhile, other associates and joint ventures reported reduced losses compared to the prior year.
Overall, the increased profit contributions from major associates and joint ventures were sufficient to offset the weaker performance of certain other associates and joint ventures affected by industry-wide challenges, resulting in a net increase in the Company’s share of profit.
Share of profit (loss) from Equity Investments Unit: Million Baht | 2024 | 2025 | Change | % |
Sanoh Industries (Thailand) Company Limited | 10 | 12 | 2 | 17.0% |
Able Sanoh Industries (1996) Company Limited | 135 | 136 | 1 | 0.6% |
Sumino AAPICO (Thailand) Company Limited | 7 | 4 | (3) | (37.3%) |
Edscha AAPICO Automotive Company Limited | 15 | 15 | (0) | (2.4%) |
Nuro Technology Incorporate | 7 | (5) | (12) | (165.5%) |
PUREM AAPICO Company Limited | 68 | 89 | 21 | 30.7% |
Other companies | (11) | (10) | 1 | 9.4% |
Profit Sharing from Investments | 232 | 241 | 9 | 4.0% |
Net Profit attributable to equity holders
Net profit decreased from Baht 747 million in 2024 to Baht 731 million in 2025, primarily due to lower revenue and a slight contraction in gross profit margin. However, the impact was partially mitigated by improved cost control, reflected in a lower SG&A-to-sales ratio, as well as reduced net finance costs and tax expenses. As a result, the Company was able to maintain the net profit margin at 2.8% in 2025.
Net Profit attributable to equity holders excluding gain (loss) on foreign currency exchange rate and one-time expenses (Core net profit)
Core net profit decreased from Baht 763 million in 2024 to Baht 754 million in 2025 after adjustments for impairment loss on investments, and foreign exchange losses totaling Baht 22.4 million in 2025.
Profitability
Unit: In % or times | 2024 | 2025 |
Gross Profit Margin (%) | 8.69% | 8.50% |
Net Profit Margin (%) | 2.77% | 2.80% |
Return on Assets (%) | 3.09% | 3.22% |
Return on Equity (%) | 7.00% | 6.83% |
Gross Profit Margin (%) slightly decreased from 8.69% in 2024 to 8.50% in 2025, primarily due to electricity blackout in Portugal during Q2 2025. The incident reduced one plant’s capacity to approximately 50% for three weeks during peak demand, leading to higher fixed cost and increased inventory utilization to meet customer orders.
Net Profit Margin (%) marginally increased from 2.77% in 2024 to 2.80% in 2025, despite a 3.1% decline in revenue and a slight decrease in gross profit, supported by lower SG&A-to-sales ratio, and reduced net finance costs and tax expenses.
Return on Assets (ROA) improved slightly to 3.22% in 2025, reflecting efficient asset utilization while Return on Equity (ROE) slightly decreased to 6.83%, mainly due to lower net profit and a higher equity base from retained earnings.
Liquidity & Capital Adequacy
Liquidity and Capital Adequacy
Unit: In % or times | 2024 | 2025 |
Current Ratio (Times) | 1.08 | 1.17 |
Quick Ratio (Times) | 0.68 | 0.79 |
Debt to Equity Ratio (Times) | 1.10 | 1.03 |
Interest bearing Debt to Equity Ratio (Times) | 0.49 | 0.50 |
Net Debt to Equity Ratio (Times) | 1.00 | 0.83 |
Interest Coverage Ratio (Times) | 2.91 | 3.54 |
Current Ratio improved from 1.08 to 1.17 times in 2025, while Quick Ratio increased from 0.68 to 0.79 times in 2025. This improvement was driven by a greater reduction in current liabilities compared to current assets, as the Company restructured some short-term bank loans into long-term bank loans. The Company believes its liquidity risk remains low, supported by positive cash flow from operations, a strong balance sheet, and continued solid backing from its lenders.
Debt to Equity Ratio slightly decreased from 1.10 times in 2024 to 1.03 times in 2025, reflecting the Company’s prudent capital structure management, with the level of liabilities maintained in line with the growth of shareholders’ equity.
Interest bearing Debt to Equity Ratio marginally increased from 0.49 times in 2024 to 0.50 times in 2025.
Net Debt to Equity Ratios decreased from 1.00 times to 0.83 times in 2025, mainly due to an increase in cash and cash equivalents. The ratio remained in compliance with financial covenants set by financial institutions, staying below the 2.00 times threshold.
Interest Coverage Ratio improved from 2.91 times to 3.54 times in 2025, attributable to a larger decrease in finance costs relative to the decline in operating profit, reflecting the Company’s ability to effectively manage its debt obligations and adequately support its financing costs.
The Company had capital expenditures of Baht 1,238 million in 2025, an increase from Baht 1,160 million in 2024. The expenditures were primarily invested in machinery and production line improvements to enhance production efficiency, support the Company’s long-term business operations, and growth in future business.
Asset Management Capability
Financial Position Analysis
Balance Sheet Unit: Million Baht | 2024 | 2025 | Change | % |
Cash and cash equivalents | 793 | 2,296 | 1,503 | 189.7% |
Trade and other receivables | 3,389 | 3,423 | 34 | 1.0% |
Inventories | 3,398 | 3,062 | (336) | (9.9%) |
Investments in associates and joint ventures | 1,270 | 1,377 | 107 | 8.4% |
Other current financial assets | 1,295 | 67 | (1,228) | (94.9%) |
Long-term loans to related parties | 61 | - | (61) | (100.0%) |
Property, Plant, and Equipment | 7,983 | 8,055 | 72 | 0.9% |
Goodwill | 1,057 | 1,098 | 41 | 3.8% |
Other Intangible Assets | 1,439 | 1,464 | 25 | 1.7% |
Right-of-use assets | 704 | 684 | (20) | (2.8%) |
Other Assets | 1,687 | 1,716 | 29 | 1.7% |
Total Assets | 23,076 | 23,240 | 164 | 0.7% |
Trade and other payables | 5,513 | 4,899 | (614) | (11.1%) |
Short-term loans from banks | 1,428 | 1,430 | 2 | 0.2% |
Current portion of long-term loans and debentures | 1,126 | 1,156 | 30 | 2.7% |
Long-term loans | 2,878 | 3,128 | 250 | 8.7% |
Advances received from customers | 210 | 157 | (53) | (25.4%) |
Other Liabilities | 928 | 1,049 | 121 | 13.0% |
Total Liabilities | 12,083 | 11,819 | (264) | (2.2%) |
Total Shareholders’ Equity | 10,993 | 11,421 | 428 | 3.9% |
Assets
Total assets increased by Baht 164 million to Baht 23,240 million in 2025. The increase was mainly attributable to higher cash and cash equivalents, primarily resulting from SGAH’s reclassification of certain fixed-term deposits to cash and cash equivalents. If cash and cash equivalents are combined with other current financial assets, which include fixed-term deposits, the net increase would amount to Baht 275 million.
Most trade receivables were classified into not yet due and past due not over 3 months. For trade receivables which past due more than 3 months, the Company provided appropriate provisions, followed by the Company’s policy. Additionally, most trade receivables over 12 months were related to company trade receivable which was associated with Sakthi Automotive Group USA Inc. (SAGUSA) which has completed its liquidation. The Company has already provided full amount of provision. The Company also provided appropriate allowance for other receivables. Inventories decreased by Baht 336 million, primarily due to inventory reductions in the Portugal operation.
Liabilities
Total liabilities decreased by Baht 264 million to Baht 11,819 million, largely attributable to decrease in trade accounts payable. Nevertheless, Interest Bearing Debt increased from Baht 5,432 million to Baht 5,714 million, mainly attributable to additional long-term loan drawdowns to finance working capital requirements and capital expenditure investments.
Shareholders’ Equity
Total shareholders’ equity increased by Baht 428 million to Baht 11,421 million in 2025, primarily driven by profit during the year.
Asset Management Efficiency
Unit: In Days or times | 2024 | 2025 |
Asset Turnover Ratio (Times) | 1.12 | 1.13 |
Average Sales Period (Days) | 52 | 49 |
Average Collection Period (Days) | 50 | 48 |
Average Payment Period (Days) | 92 | 79 |
Cash Conversion Cycle (Days) | 10 | 18 |
Asset Turnover Ratio slightly increased to 1.13 times in 2025, reflecting the Company’s efficient and consistent use of assets to generate revenue, supported by effective asset management and appropriate utilization of production capacity.
Average Sales Period (days) decreased from 52 days in 2024 to 49 days in 2025 Average Collection Period declined from 50 days in 2024 to 48 days in 2025 and Average Payment Period (days) largely reduced from 92 days in 2024 to 79 days in 2025 as accounts payable decreased at a higher rate relative to the decline in cost of goods sold.
Debt Obligations & Off-Balance-Sheet Management
In terms of the off-balance sheet obligations, the Company provided a guarantee for bank credit facilities of a local associate amounting to Baht 50 million in 2025, compared to none in 2024. In addition, the credit risk of domestic associated companies is low.
Other Analysis
| Title | Description | |||||||||||||||||||||||||||||||||||||||||||||||||||||||
|---|---|---|---|---|---|---|---|---|---|---|---|---|---|---|---|---|---|---|---|---|---|---|---|---|---|---|---|---|---|---|---|---|---|---|---|---|---|---|---|---|---|---|---|---|---|---|---|---|---|---|---|---|---|---|---|---|
| Cash Flow Management | Cash Flow Analysis
/1 There are some classification adjustments in Investing Activity and Financing Activity in 2024 and 2025. Net cash flows from operations in 2025 were Baht 1,632 million compared to Baht 1,570 million in 2024. The increase was primarily attributable to changes in operating working capital. Net cash flows from investing activities amounted to Baht 389 million. The cash outflows were mainly attributable to the acquisition of plant, machinery and equipment totaling Baht 1,238 million, partially offset by cash inflows from the reclassification of fixed deposits (Other current financial assets) to cash and cash equivalents of Baht 1,137 million. The Company also received cash dividends from associates amounting to Baht 163 million and proceeds of Baht 221 million from the sale of shares in a company in India. Net cash flows used in financing activities were Baht 444 million, primarily attributable to repayment of long-term loans from banks, dividend and interest payments. As a result, net cash increased by Baht 1,503 million in 2025, compared to a net cash decrease of Baht 1,274 million in 2024. Cash and cash equivalents at the end of the year 2025 stood at Baht 2,296 million, compared to Baht 793 million in 2024. | |||||||||||||||||||||||||||||||||||||||||||||||||||||||
Debt Securities with Financial Ratio Requirements
Debt Securities with Financial Ratio Requirements Issued?
No
Factors That May Affect Financial Condition
Factors or Incidents That May Materially Affect Financial Condition
AAPICO’s main businesses are in automotive industry. The Company’s performance therefore is related to automotive demands and markets in Thailand, Malaysia, Europe and China. For the year 2026, the Federation of Thai Industries (FTI) expects automotive production volume to slightly grow approximately 3.0% YOY to 1.50 million units, of which 0.95 million units for export and 0.55 million units for domestic sales. The Malaysian Automotive Association (MAA) forecasts total industry volume in 2026 to decline by 3.8% YoY to approximately 790,000 units, compared to 820,752 units in 2025. The strong performance in 2025 was supported by a resilient domestic economy, a stable Overnight Policy Rate (OPR), new launches, and aggressive sales promotions by OEMs. The projected moderation in 2026 reflects expectations of softer consumer demand following the high base in 2025 and a potentially more cautious spending environment. European car production in 2026 is expected to remain under pressure, with volumes projected to be broadly stable or marginally higher compared with 2025, reflecting continued demand uncertainty, competitive pressures, and ongoing structural challenges in the automotive industry. The China Association of Automobile Manufacturers (CAAM) forecasts that total vehicle sales in China will increase modestly by 1.0% YOY to approximately 34.80 million units in 2026, while exports are expected to grow by about 4.3% to around 7.40 million units. New energy vehicle (NEVs) sales are projected to expand by approximately 15.0%, continuing to underpin industry growth and highlighting the ongoing shift toward electrification.
The Company expects its sales performance to generally align with overall trends in the automotive industry. With a solid pipeline of secured projects, the Company remains confident in its medium- to long-term growth and its ability to deliver sustainable value to shareholders. With a strong balance sheet and robust financial health, as reflected in a total shareholder’s equity of approximately 11.4 billion and an interest-bearing debt-to-equity ratio of 0.5 times, AAPICO is well-positioned to capitalize on a potential recovery in the automotive industry.
Projects or R&D Affecting Future Results
With the continued focus on TURBO actions and ESG initiatives, the Company will further enhance operational efficiency, strengthen cost control, and explore opportunities in new markets to expand its presence in the global arena. This includes the establishment of our new joint venture in the United States, marking the Group’s entry into a new high-potential market. The Company will pursue this ambition through strategic collaborations with leading automotive and technology partners, focusing on EV components, automation, and operational efficiency, while also sustaining organic growth across existing operations. The Company remains committed to sustainable development, with continued emphasis on quality, cost, delivery, management, and engineering innovation to uphold operational excellence and drive continuous improvement across the AAPICO Group.